The histogram is a subject that is often misunderstood. One common misconception is that 'the graph should always be centered.' This article explains exactly what a histogram is and how you can use it to determine the correct exposure.
A histogram translates the color image in the viewfinder into a graph. The color image is represented in 256 tonal steps, from pure black to absolute white.
These steps appear along the graph's horizontal axis. Dark areas are on the left and light areas on the right. The vertical axis shows how frequently each brightness level occurs in the image. A brightness level that appears often produces a tall peak in the histogram; a less common tone barely rises above the horizontal axis.

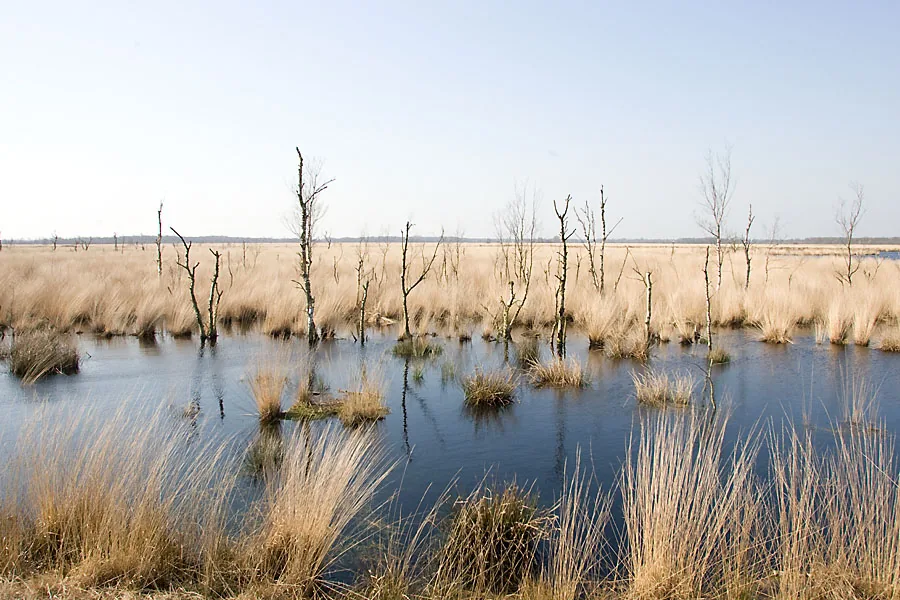
In the photograph, we can see several small dark areas, such as the shadows in the sand and the dark water. These produce the small peaks on the left side of the histogram.

The lightest areas of the sand, as well as the sky, appear on the right side of the histogram. Because the image contains relatively few very light or very dark areas, the histogram peaks in the middle.
Overexposure and underexposure
Overexposure or underexposure is easy to recognize in a histogram. The histogram for the overexposed photograph below is cut off by the right-hand axis.
When the histogram touches the vertical axis on either side, this is known as clipping
This means the image contains areas so bright that the sensor can no longer record them. In the photograph, this appears as a blown-out sky on the left side of the image.
The same applies to underexposure. In that case, the histogram is pushed against the left-hand vertical axis. Dark areas in the image lose all detail and become solid black.

When the histogram touches the vertical axis on either side, this is known as clipping. Try to avoid this by adjusting the exposure.
Exposure compensation using the histogram
Underexposure and overexposure can cause clipping, but not always. Sometimes the histogram remains neatly within the camera's dynamic range even though the image is still incorrectly exposed.
Within the limits of the camera's contrast range, yet still incorrectly exposed...
I will illustrate this situation with several examples and focus on what you can do to correct the exposure.
The photograph below shows a landscape dominated by dark areas. However, these areas are not rendered as dark as they were in reality; instead, they appear gray. We can also see that the histogram lies mainly around the middle of the horizontal axis.
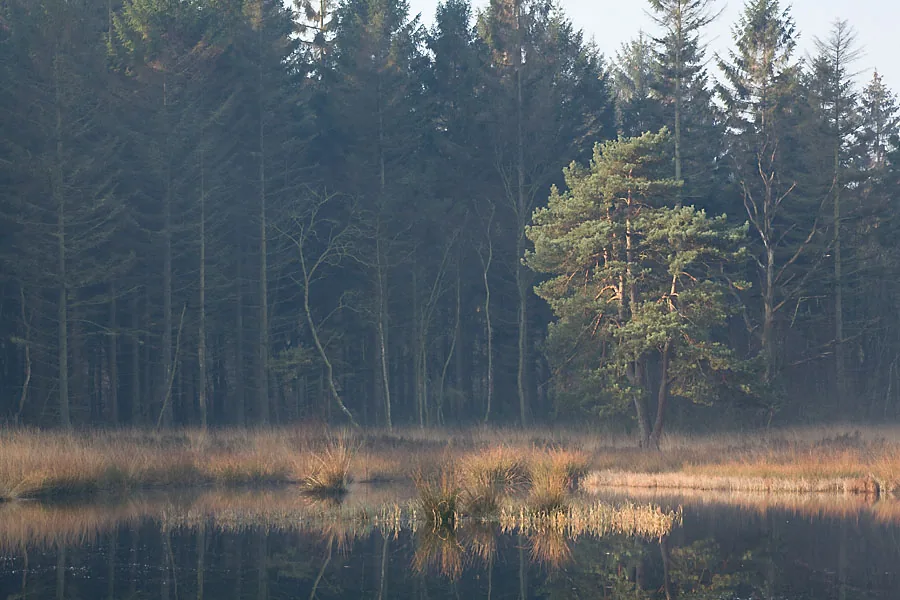
This image does not contain equal amounts of light and dark areas; dark areas predominate. As a result, the camera's exposure meter will overexpose the image.
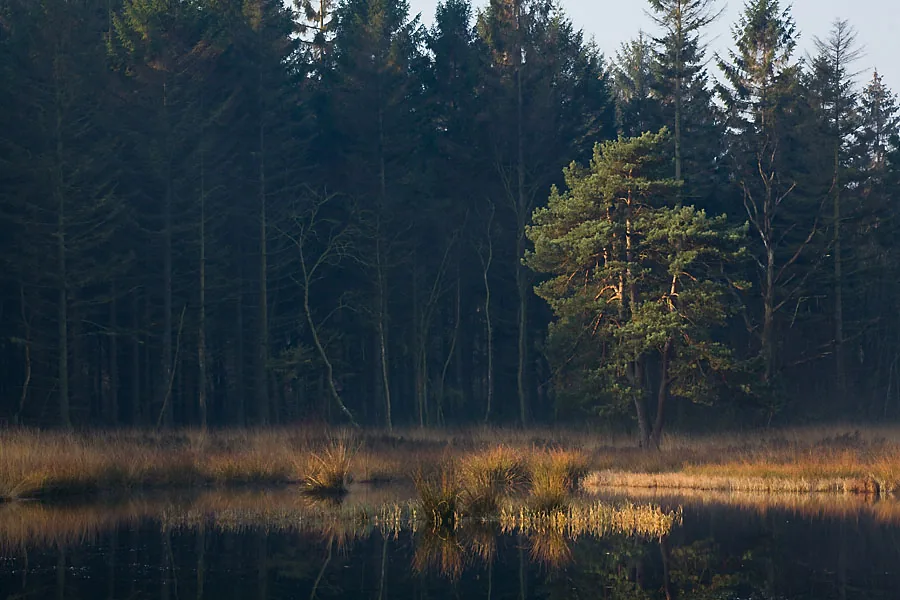
Histograms for Figures 3 and 4; the upper image has the correct exposure.


If, after taking a photograph, we see that the dark areas have not ended up in the correct part of the histogram, we know that the image is overexposed, as it is here, and that we need to apply exposure compensation. For this image, we need to reduce the exposure; compensation of -2/3 stop proves sufficient.
If we now look at the image and histogram, we can see that the dark areas are rendered correctly and appear where they belong in the histogram: on the left.
Images with many light areas
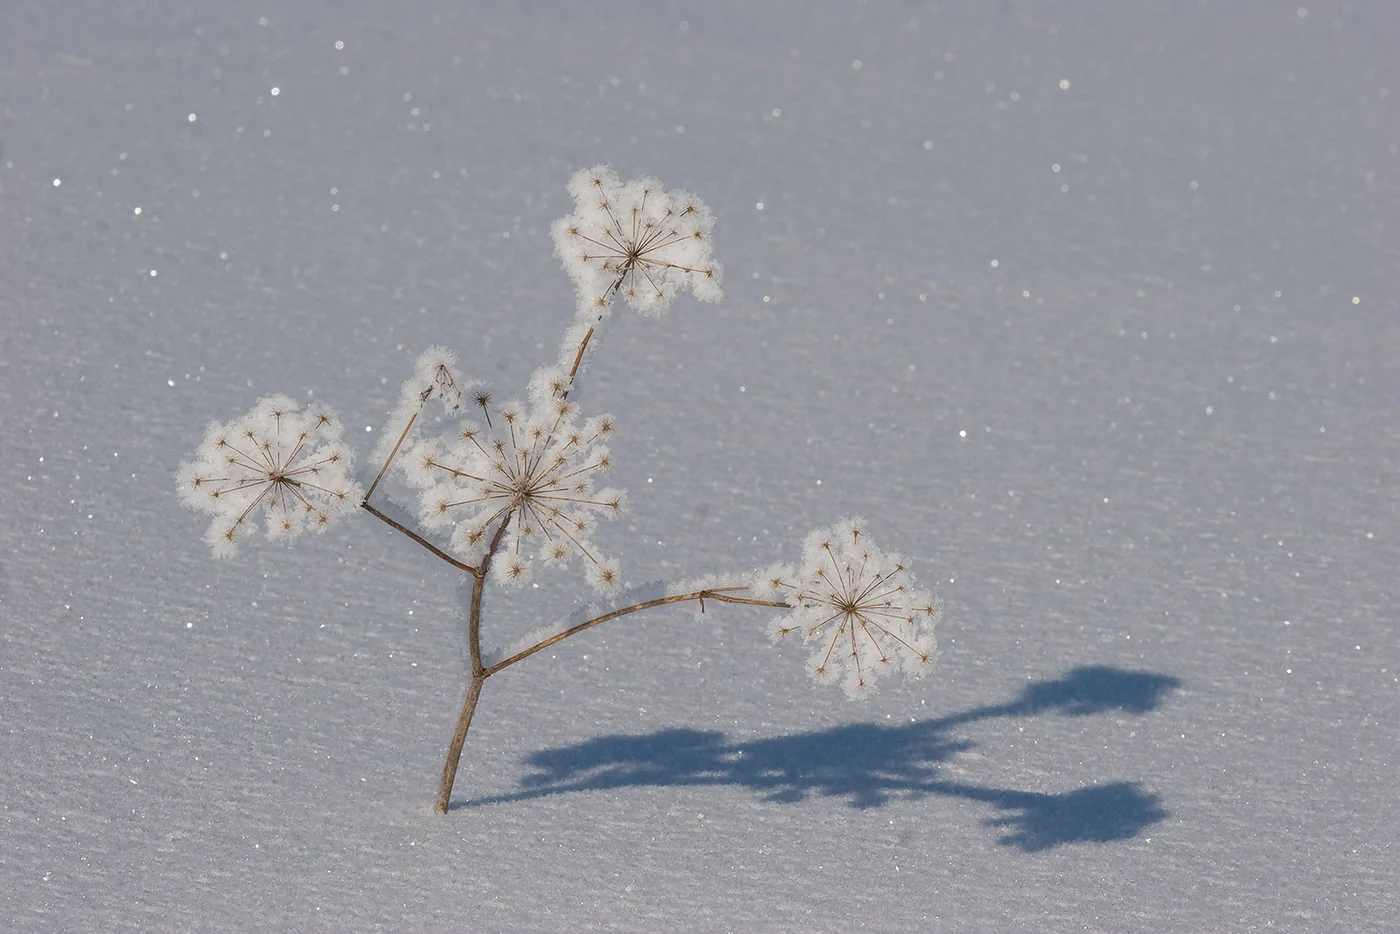
With images that contain many light areas, the camera's exposure meter tends to underexpose. As a result, white turns gray.
When we take the photograph with exposure compensation of +2/3 stop, the light areas return to their proper place in the histogram and the image looks much better.
Summary

Look critically at your subject and assess the distribution of light and dark areas as accurately as possible. Check whether those areas fall in the right place in the histogram. If they do not, apply exposure compensation. The amount of correction depends on the subject, but also on experience and judgment.